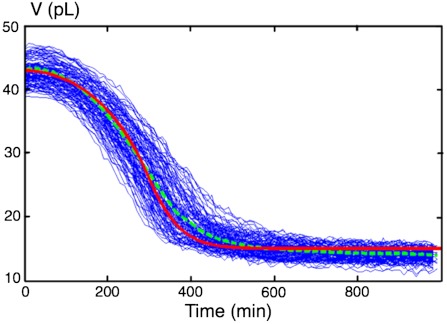
Fig. 2.
Shrinkage of nursing drops: coupling between growth and metabolism. Cells were encapsulated in culture medium containing 20 g/L glucose, where glucose becomes limiting. Blue, experimental curves for 195 droplets. Green dashed line, mean curve. Red, master curve obtained from the model using Y = 0.15 g(biomasse)/g(glucose) and τ = 120 min.

