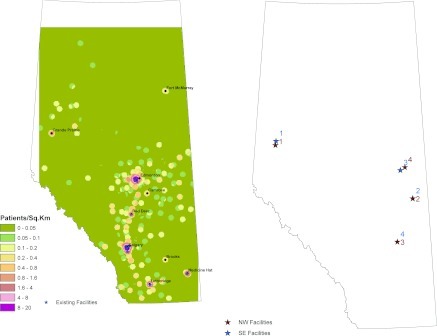
Figure 1.
(A) The existing facilities and population density of patients with eGFR <45 ml/min per 1.73 m2. Red shading denotes higher density; green shading denotes lower density. (B) The proposed nephrology facilities and the effect of the starting the search for a new nephrologist facility in the southeast corner of Alberta instead of the northwest corner as in the primary analysis.

