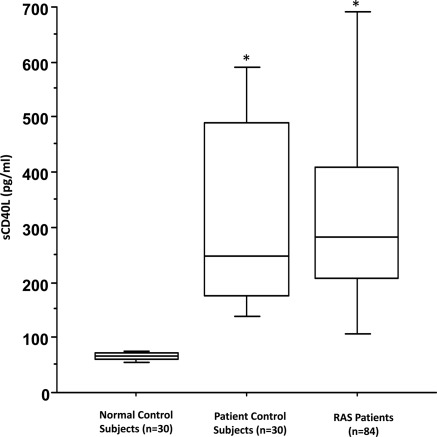
Figure 1.
Soluble CD40L (sCD40L) levels in normal controls, patient controls, and renal artery stenosis (RAS) patients. Box plot represents interquartile range with the median value shown as a horizontal bar within each box. Minimum and maximum values are shown in the bars outside each box. *P < 0.001 versus normal control subjects.

