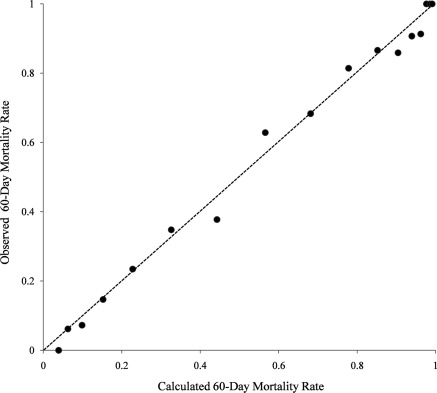
Figure 1.
Calibration of risk model for 60-day mortality. Horizontal axis represents actual observed 60-day mortality, whereas vertical axis is the predicted probability using the multivariable logistic regression model. Broken line indicates the line of identity (ideal prediction model). Circles represent subgroups of our cohort.

