Fig 4.
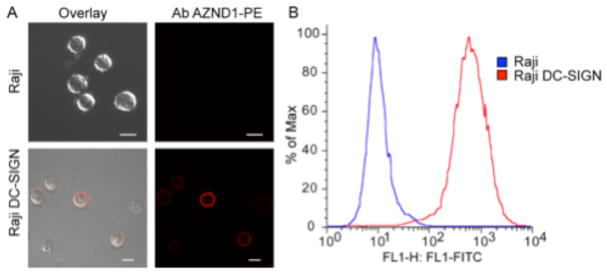
Measurement of cell surface expression of DC-SIGN transfected Raji cells. (A) Visualization of cell surface expression using the DC-SIGN–specific antibody AZND1-PE (Ab AZND1-PE) and (B) Assessment of the level of cell surface expression of DC-SIGN by flow cytometry using the DC-SIGN-specific antibody DCN46-FITC. Bars represent 10 μm.

