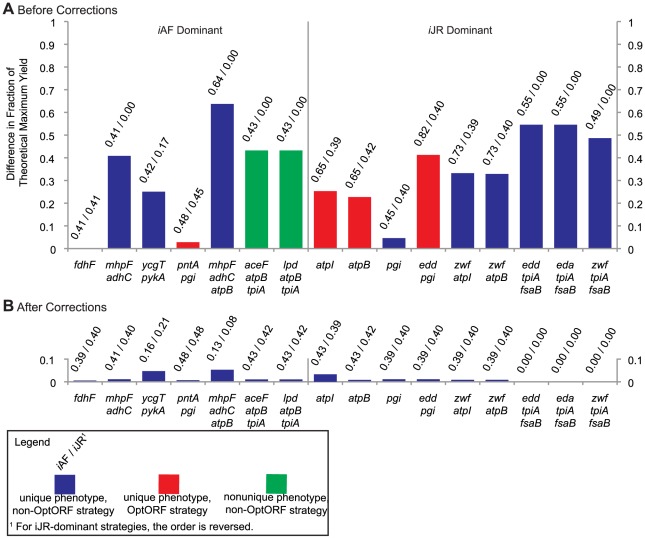
Figure 3. Model-dominant production strategies for ethanol.
(A) Deletion strategies for ethanol production. Each bar represents the absolute difference in predicted ethanol yields between the iJR904 and iAF1260 models as a fraction of the maximum theoretical yield (2 ethanol/glucose). Left side: Strategies for which the iAF1260 model predicts higher production. Right side: Strategies for which the iJR904 model predicts higher production. Corresponding gene deletion strategies involving 1, 2, or 3 genes are given below the figure. Numbers above each bar indicate the fraction of the theoretical maximum yield obtained by each model, with the dominant model listed first. Some strategies have a nonunique ethanol production phenotype, in which multiple ethanol production values can occur at the maximum growth rate. For these scenarios, the production difference calculated by CONGA is from the lowest expected level of ethanol production in each model, and such strategies are indicated in green. Strategies for which the yield of the dominant model meets or exceeds the yield for the third-best OptORF strategy for that model are known as OptORF strategies, and such strategies are indicated in red. (B) The same gene deletion strategies after reconciliation of the iJR904 and iAF1260 networks with respect to metabolic differences.

