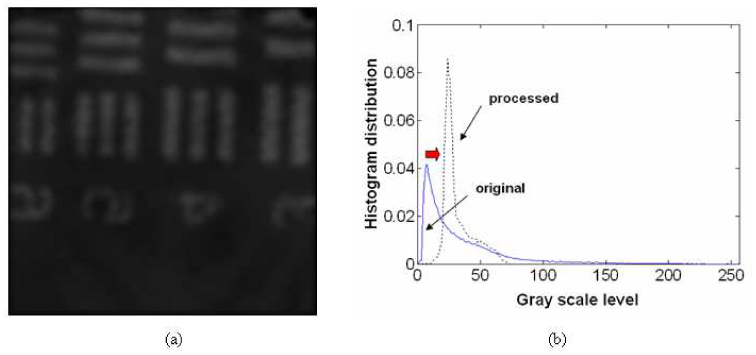
Fig. 6.

Image result after applying Gaussian smoothing filter only: (a) chart image after Gaussian filtering; (b) corresponding histogram of the processed image (original image: blue solid line; processed image: black dotted line). Inset figure: spatial frequency information (original image: blue solid line; processed image: green dotted line).
