
Fig. 7.
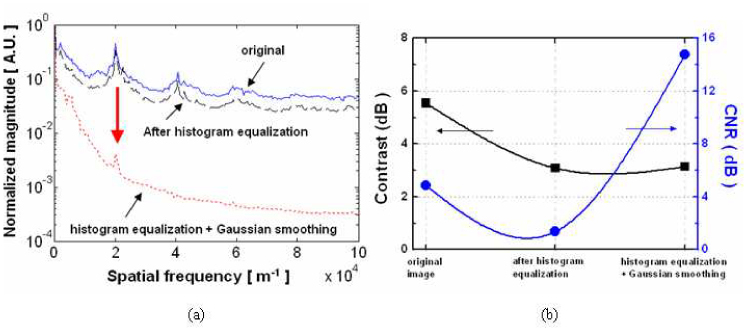
Comparison in characteristics of the image: (a) magnitude of Fourier transforms (blue solid line for original image; black dashed line for histogram equalized image; red dotted line for Gaussian smoothing filtered image with pre-histogram equalization); (b) image contrast and CNR (left y-axis for contrast with black square; right y-axis for CNR with blue circle).