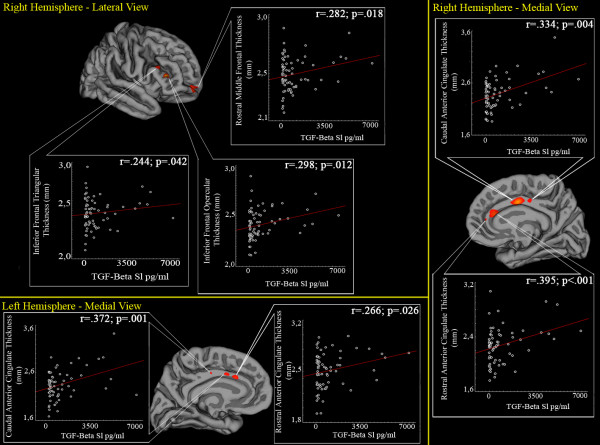
Figure 1.
Whole-brain vertex-wise analysis of correlation between cortical thickness and TGF-β1 serum levels. Maps are superimposed on the pial cortical surface. Statistical results are reported in a -log p scale. For each subject, mean cortical thickness values of the clusters where significant results emerged were extracted. Scatterplots of cortical thickness and TGF-β1 levels are also reported, including Pearson's r coefficients and p values (linear fits are shown in red).

