
Figure 4.
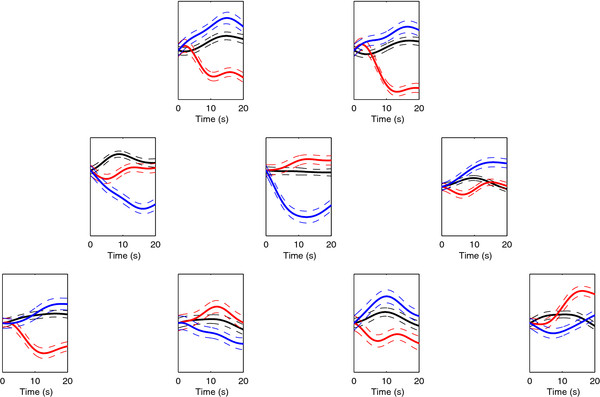
Example hemodynamic signals for mental arithmetic, music imagery and no-control. Normalized light intensity versus time plots showing the hemodynamic response for mental arithmetic (red), music imagery (blue) and no-control (black) over the 20 s system-vigilant period. Only the signals from the 830 nm sources are shown. For each task, the signals shown are the average over all samples for one of the participants for whom the three-class classification was successful (P7). Dashed lines indicate standard error.