Figure 2.

Frequency spectra at inspiration and expiration. The lowest frequency of the first strong amplitude signal was measured during inspiration and expiration and the difference between these frequencies was termed ΔF.

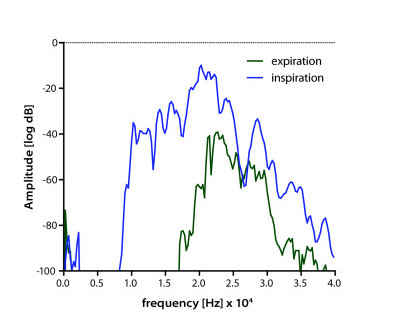
Frequency spectra at inspiration and expiration. The lowest frequency of the first strong amplitude signal was measured during inspiration and expiration and the difference between these frequencies was termed ΔF.