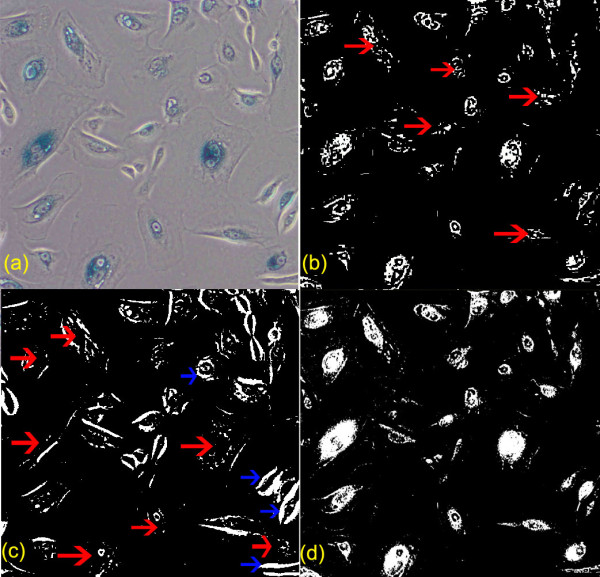
Figure 3.

Comparison of automatic cell segmentation results by K-means clustering, Otsu clustering and a proposed method. Comparison of cell segmentation results, with the segmented regions by individual techniques highlighted in white: (a) raw image, (b) cell segmentation by K-means clustering with various misdetections pointed by the red arrows, (c) cell segmentation by Otsu clustering with plenty misdetections pointed by the red arrows and false detection pointed by the blue arrows (d) cell segmentation by the presented method with greatly improved outcome (much less misdetection and false detection).
