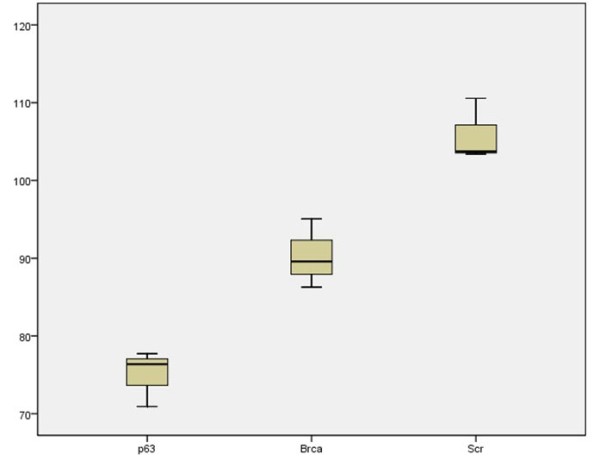
Figure 4.

Consistent quantification results in variant to the number of cells appearing. The proposed cell replication scores are stable with consistent outputs for images in the same cell replication level, invariant to the number of cells captured in the image: three live cell images from individual cell replication group were selected; the first column contain low quantity of cells and the second and third columns contain high quantity of cells. The scores for each row are consistent. (a,b,c) from the low cell replication group (p63), (d,e,f) from the medium cell replication group (BRCA1), (g,h,i) from the high cell replication group (Scr).
