Figure 5.

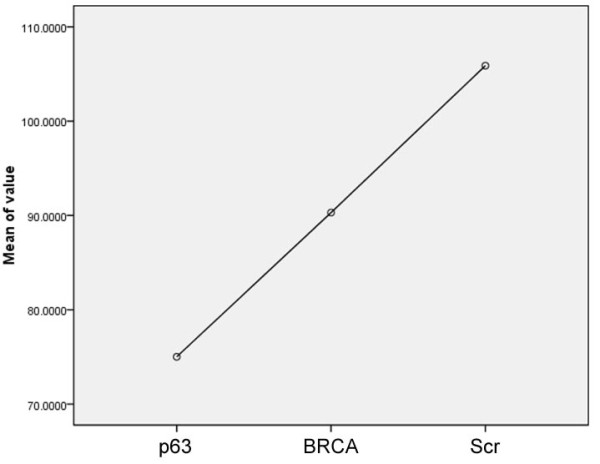
Means Plot of Quantification Scores. This figure displays the means plot of the three group from the low cell replication group (p63) to the high cell replication group (Scr).

Means Plot of Quantification Scores. This figure displays the means plot of the three group from the low cell replication group (p63) to the high cell replication group (Scr).