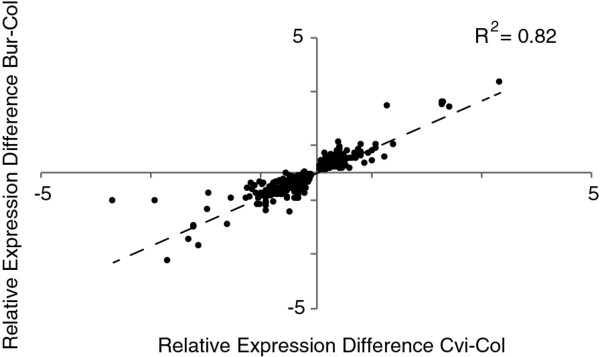
Figure 2.
Correlation between relative expression levels for potentially shared local eQTLs between the CviCol and BurCol sets. The relative allelic expression level at the eQTL was plotted for transcripts sharing local eQTLs with additive effects in the same direction in both populations. The linear regression and correlation is indicated with a dashed line.

