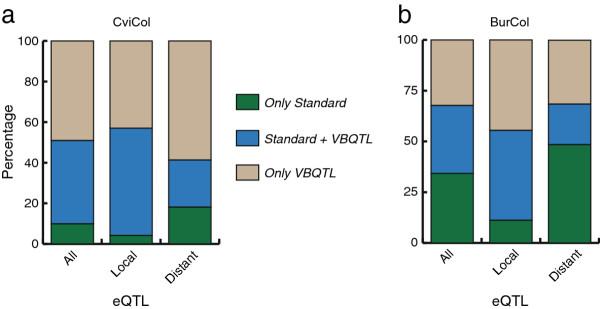
Figure 4.
Bar plot showing overlap and specific eQTL detections when comparing the VBQTL and standard approach. Linkage mapping methods were compared and blue regions denote the percentage of common eQTLs mapped at a 5% FDR using both approaches. eQTLs solely mapped in one or the other strategy are depicted at the bar-extremes (in green and brown). Ten factors were included in the VBQTL analysis. a. CviCol set, b. BurCol set.

