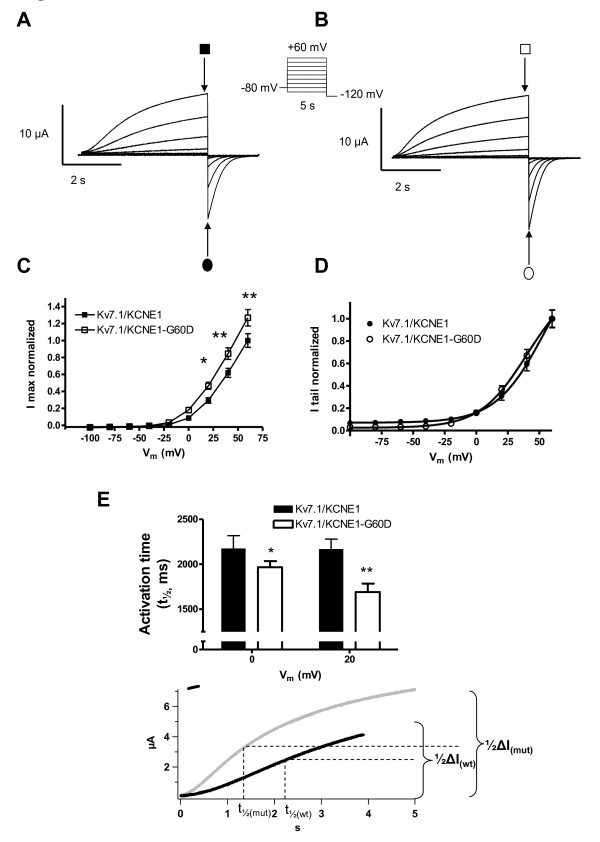
Figure 2.
Comparison of IKs-WT and IKs-G60D channel currents. Representative current traces for KCNE1-WT (A) and KCNE1-G60D (B) channel subunits co-expressed with KV7.1 in X.laevis oocytes in a 1:1 molar ratio. Current step protocol is shown as inset. C: I/V relationship for IKs-WT (n = 21) and IKs-G60D (n = 23) as determined from peak currents (open and filled squares). D: Voltage-dependence of IKs-WT and IKs-G60D channel activation as determined from tail currents (open and filled circles). E: Activation rise time, determined as the time to 1/2 max following a depolarization to 0 mV or +20 mV.

