
Figure 6.
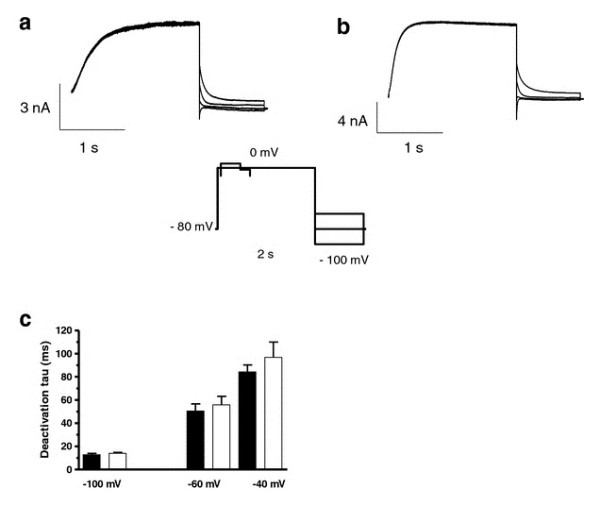
Comparison of IKs-WT and IKs-G60D channel deactivation kinetics. KCNE1-WT (A) and KCNE1-G60D (B) channel subunits co-expressed with KV7.1 in CHO cells. Currents were elicited by clamping the cells for 2 s at 0 mV, followed by a 1 s step to test potentials ranging from -100 to -20 mV in 20 mV increments, at 36 ± 1°C. (C) Enlargement of the tail-currents normalized to maximum current amplitude (gray: IKs-WT; black: IKs-G60D). Deactivation time constants (tau) were obtained by fitting the tail-current traces to a mono-exponential function (D).