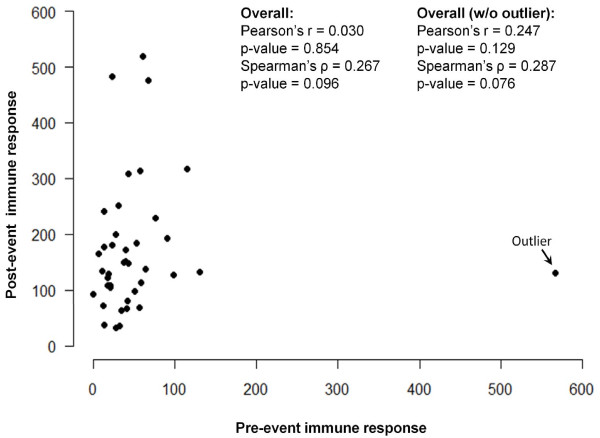
Figure 3.
Scatter-plot of pair measurements: the baseline IR values are shown on a horizontal axis -- labeled as "Pre-event immune response" -- and the measurements for the second time point -- labeled as "Post-event immune response" are on a vertical axis. An outlier is marked. Values of Pearson's and Spearman's correlation coefficients are shown for all subjects with and without the outlier.

