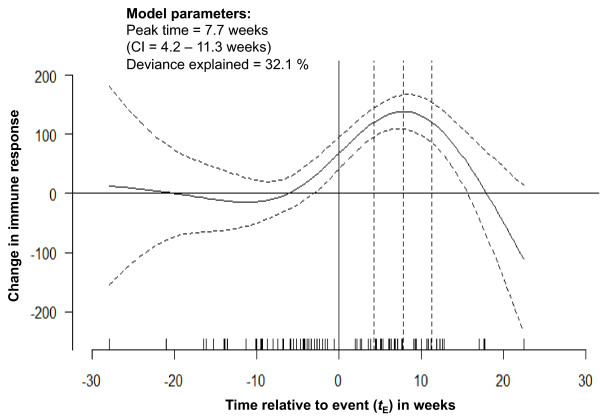
Figure 7.
Predicted change in immune response, based on generalized additive modeling -- with cubic-splines supported by 5 knots -- reflects the average change for the whole range of measurement timing along with the 95% confidence interval indicating the degree of uncertainty in the detected pattern. The estimates of peak timing are shown.

