
Figure 2.
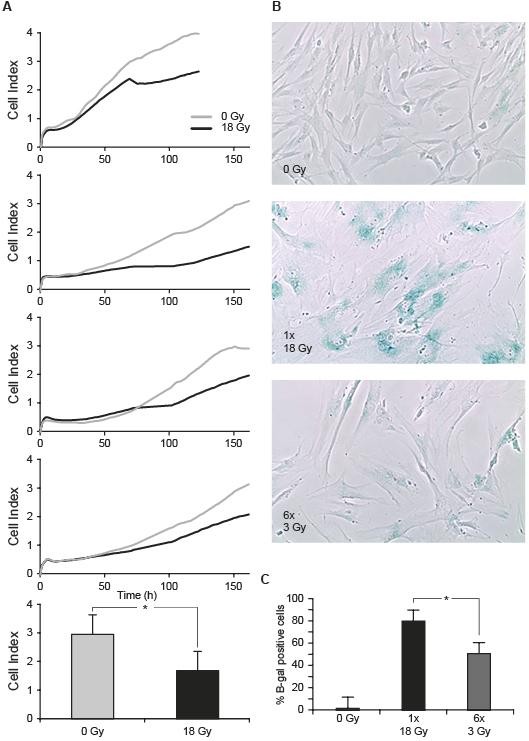
Attenuation of the proliferative capacity of irradiated CAFs, and induction of premature senescence: (A) Proliferation curves monitored over one week of non-irradiated cells (grey line) and cells receiving 1 × 18 Gy (black line) from four randomly selected donors (donors #15, #6, #7, #8 in Table 1). In lower panel, statistically significant differences found after applying paired sample t-test on values at the end point of the experiments are marked with * (p < 0.05). (B) β-galactosidase staining assay in CAFs from one randomly selected donor. The percentage of β-galactosidase positive cells in each condition was calculated from three different donors (donors #1, #7, #11 respectively from Table 1) and plotted in (C). Statistically significant differences are marked with * (p < 0.05).