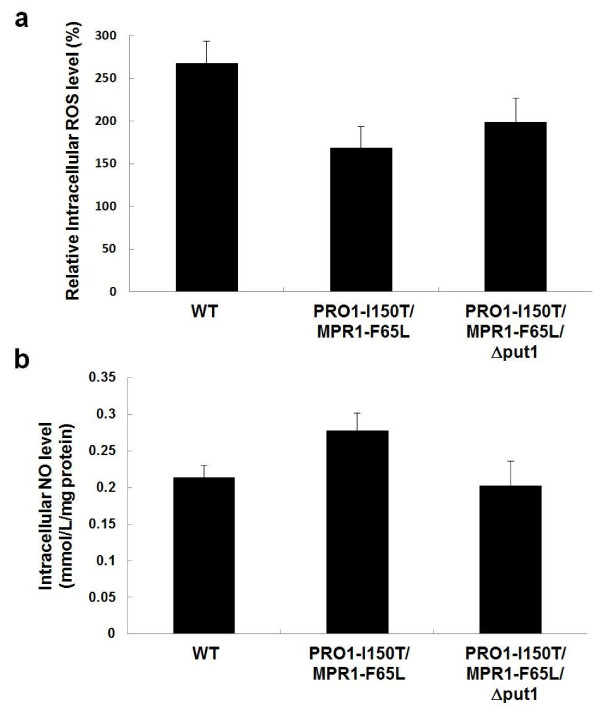
Figure 4.
Intracellular levels of ROS and NO of baker's yeast strains after air-drying stress treatment. (a) Intracellular oxidative levels after air-drying stress was measured by the method described in Methods section. The fluorescence intensity before stress treatment of each strain was defined as 100%. The values are the means and standard deviations of results from four independent experiments. Significant difference of PRO1-I150T/MPR1-F65L from WT was confirmed by Student's t test (P < 0.005). (b) Intracellular NO levels after air-drying stress was measured by the method described in Methods section. The values are the means and standard deviations of results from four independent experiments. Significant difference of PRO1-I150T/MPR1-F65L from WT and PRO1-I150T/MPR1-F65L from Pro1-I150T/MPR1-F65L/Δput1 was confirmed by Student's t test (P < 0.01) and (P < 0.05), respectively.

