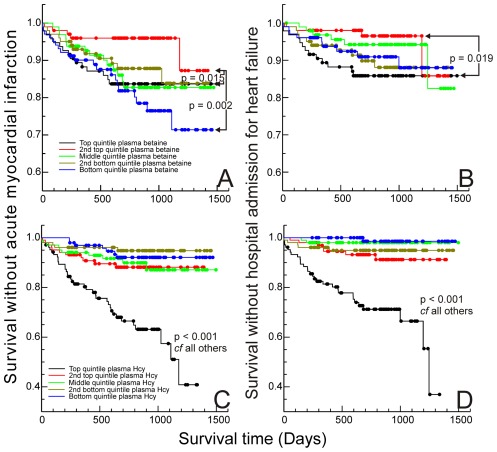
Figure 2. Outcomes in quintiles.
Kaplan-Meier curves for time to first secondary event after samples taken: A & B: quintiles of gender-adjusted plasma betaine concentrations, A without acute MI, B without admission to hospital for heart failure; C & D: quintiles of plasma homocysteine concentrations, C without acute MI, D without admission to hospital for heart failure. Significance based on log-rank statistic for paired comparisons.

