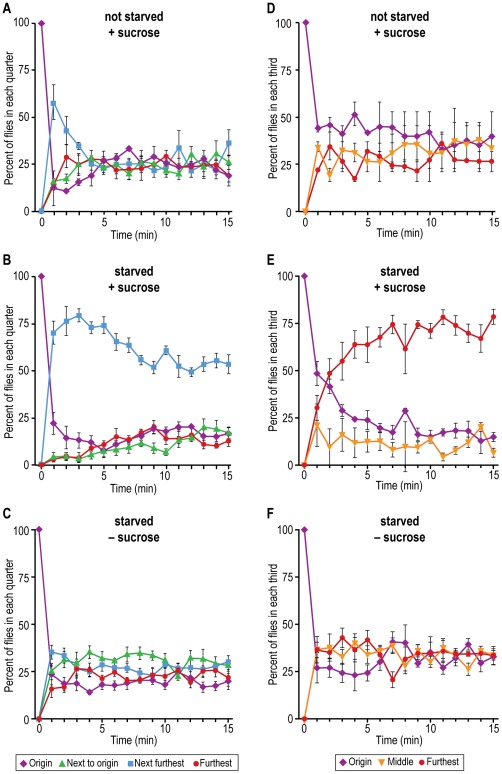
Figure 12. Attraction of flies to a non-volatile chemical, sucrose.
Method 1: Agar throughout, sucrose in one half. Data are presented for each of the quarters. A) Flies not starved. Mean ± S.E.M. for 3 experiments. B) Flies starved. Mean ± S.E.M. for 5 experiments. C) Flies starved, control without sucrose. Mean ± S.E.M. for 5 experiments. Method 2: Sucrose with agar at end. Data are presented for each of the thirds. D) Flies not starved. Mean ± S.E.M. for 2 experiments. E) Flies starved. Mean ± S.E.M. for 4 experiments. F) Flies starved, control without sucrose. Mean ± S.E.M. for 4 experiments.

