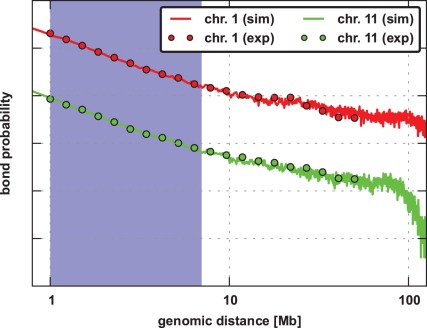
Figure 3. Log-log plot of loop size distributions for chromosomes 1 and 11 of K562 lymphoblastoid (continuous line) with the corresponding data from Hi-C experiments (circles) [9].
As the distributions for the chromosomes are strongly overlapping, the graphs were shifted by different constants in order to improve the illustration of each distribution.

