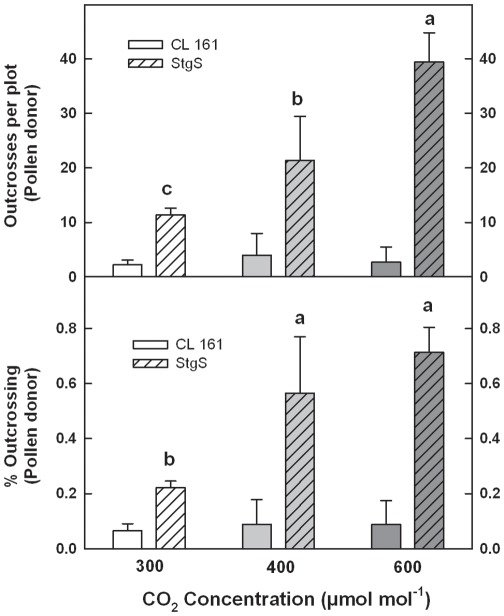
Figure 3. Percent outcrossing and outcrosses per plot for the pollen donor as detected in cultivated and wild rice populations in the field plots.
Outcrosses were always significantly higher for the StgS relative to the CL 161 population regardless of CO2 concentrations (not shown). Different letters indicate a significant population by CO2 concentration interaction for lthe StgS relative to the CL 161 population. Bars are ±SE

