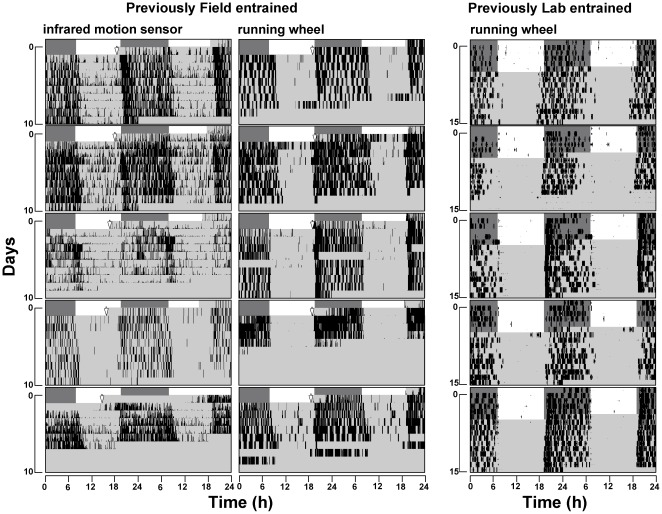
Figure 1. Comparison of activity phase in constant lab conditions of animals entrained previously to lab and field conditions.
Double-plotted actograms show infrared motion detected general activity of five individuals (left panel), and wheel-running activity of another five individuals (middle panel) that were trapped directly from the field. Laboratory animals (right panel) show wheel-running activity entrained to LD 12∶12 and then released into constant conditions. In all cases, activity was concentrated in the phase corresponding to night in the field or dark phase in the lab (from 19:00 to 07:00). Vertical arrows indicate the time when the animal was released into its lab cage and activity measurement began. The light gray background represents the constant darkness of the lab, while the dark gray and white backgrounds represent the timing of natural light/dark cycles (civil twilights according to the U.S. Naval Oceanography Portal, www.usno.navy.mil).

