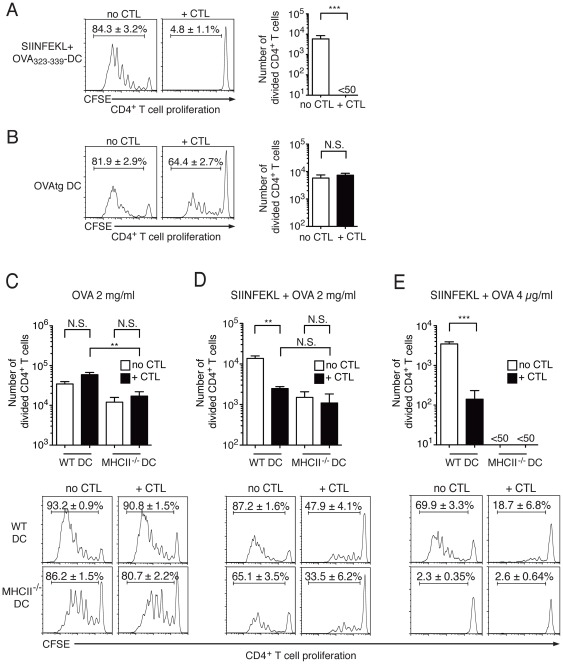
Figure 2. The impact of CTL-mediated killing of DC on CD4+ T cell proliferation is determined by the form of antigen loaded on DC.
C57BL/6 mice were injected i.v. with CFSE-labelled, CD45-congenic OT-II cells; OT-I CTL were also injected in half of the mice at the same time. 24 h later all mice were immunized s.c. with DC loaded with different forms of OVA. CD4+ T cell proliferation in dLN was determined by flow cytometry 3 days after DC immunization. Representative flow cytometry histograms of CD45.1+CD4+ T cells from individual dLN are on the left of the bar graphs for panels A and B, and below the bar graphs for panels C–E. The mean ± SEM of the percent divided cells for the corresponding group is shown in each panel. Bar graphs show mean+SEM of the number of divided CD45.1+CD4+ T cells per dLN. (A) CD4+ OT-II T cell proliferation in mice immunized with WT DC loaded with SIINFEKL and OVA323–339. The bar graph shows data from one of two independent experiments with 5 mice per group that gave similar results. (B) CD4+ OT-II T cell proliferation in mice immunized with OVAtg DC. The bar graph shows data from one of two independent experiments with 5 mice per group that gave similar results. (C) CD4+ OT-II T cell proliferation in mice immunized with WT DC or MHCII−/− DC loaded with OVA protein at 2 mg/ml. The bar graph shows combined results from two independent experiments each including 5 mice per group. (D) CD4+ OT-II T cell proliferation in mice immunized with WT or MHCII−/− DC loaded with SIINFEKL and OVA protein at 2 mg/ml. The bar graph shows results from 5 mice per group. (E) CD4+ OT-II T cell proliferation in mice immunized with WT or MHCII−/− DC loaded with SIINFEKL and OVA protein at 4 µg/ml. The bar graph shows combined results from two independent experiments each including 5 mice per group.

