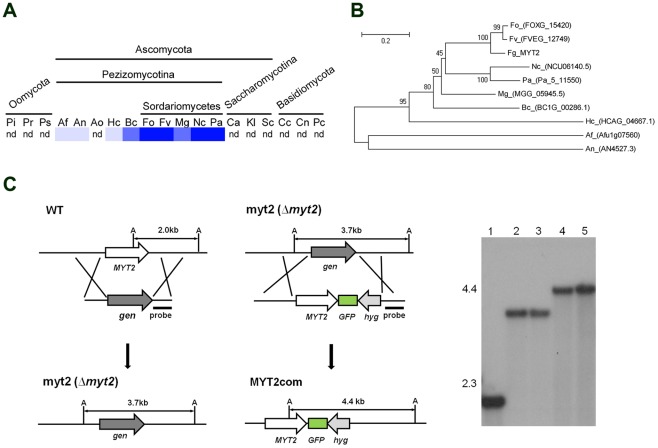
Figure 1. Distribution of MYT2 homologs in fungi and genetic complementation.
(A) Distribution of MYT2 in representative fungal species. The distribution image was constructed using the BLASTMatrix tool that is available on the Comparative Fungal Genomics Platform (http://cfgp.riceblast.snu.ac.kr/) [72]. (B) Phylogenetic tree of MYT2 homologs in several fungal species. The alignment was performed with ClustalW, and the MEGA program, version 4.0, was used to perform a 1,000-bootstrap phylogenetic analysis using the neighbor-joining method. Pi, Phytophthora infestans; Pr, P. ramorum; Ps, P. sojae; Af, Aspergillus fumigatus; An, A. nidulans; Ao, A. oryzae; Hc, Histoplasma capsulatum; Bc, Botrytis cinerea; Fo, Fusarium oxysporum; Fv, F. verticillioides; Mg, Magnaporthe grisea; Nc, Neurospora crassa; Pa, Podospora anserine; Ca, Candida albicans; Kl, Kluyveromyces lactis; Sc, Saccharomyces cerevisiae; Cc, Coprinus cinereus; Cn, Cryptococcus neoformans; Pc, Phanerochaete chrysosporium; nd, not detected. (C) Targeted deletion and complementation of MYT2. WT, G. zeae wild-type strain Z-3639; myt2, MYT2 deletion mutant; MYT2com, myt2-derived strain complemented with MYT2-GFP; A, AvaI; gen, geneticin resistance gene cassette; hyg, hygromycin B resistance gene cassette. Lane 1, Z-3639; lanes 2 and 3, MYT2 mutants; lanes 4 and 5, MYT2com mutants. The sizes of the DNA standards (kb) are indicated to the left of the blot.

