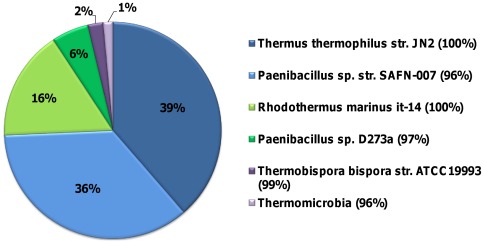
Figure 2. A pie chart showing the percent relative abundance of each taxon in the McCel-adapted thermophilic bacterial consortia.
SSU pyrosequencing was conducted to identify community members. Only members with a relative abundance greater than 1% are reported. Relative abundance is calculated as a percentage of the total number of SSU reads for the community. The closest taxon to each organism in the community is reported in the legend. The percent identity between the consortial and closest taxon SSU sequence is in parentheses.

