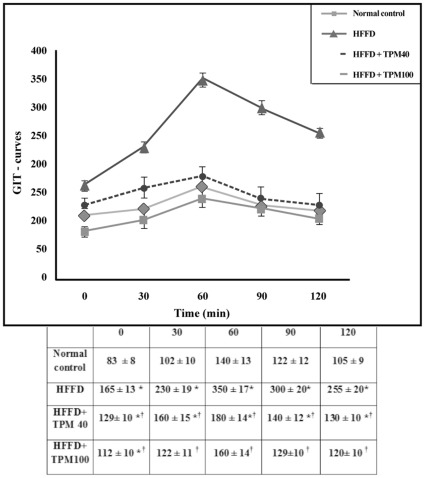
Figure 1. The glucose tolerance test (GTT).
The curve depicts the changes in serum glucose response in normal control, non-treated obese/insulin-resistant rats (HFFD), and treated ones by either dose of topiramate (40 & 100 mg/kg;HFFD+TPM40, HFFD+TPM100), after 0, 30, 60, 90, and 120 min following administration of glucose (2 g/kg, ip). Values are means (± S.D) of 10 animals; as compared with normal control (*), and HFFD (†) groups (one-way ANOVA followed by Tukey–Kramer Test), P<0.05.

