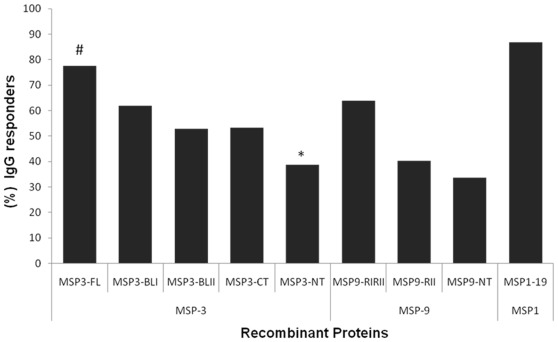
Figure 2. Frequency of IgG responders to PvMSP-1, PvMSP-3 and PvMSP-9.
Frequency of IgG responders to five recombinant proteins representing different regions of PvMSP-3α, three recombinant proteins representing PvMSP-9 and PvMSP-119 in the studied population. Chi squared test for proportions analyses were performed to determine statistical differences. # The frequency of IgG responders to PvMSP3-FL was significantly higher when compared with all others PvMSP-3α recombinants (P<0.05) * The frequency to PvMSP3-NT was the lowest when compared with all others (P<0.01), and the frequencies to PvMSP9-RIRII were higher (P<0,01) when compared with other PvMSP-9 recombinants.

