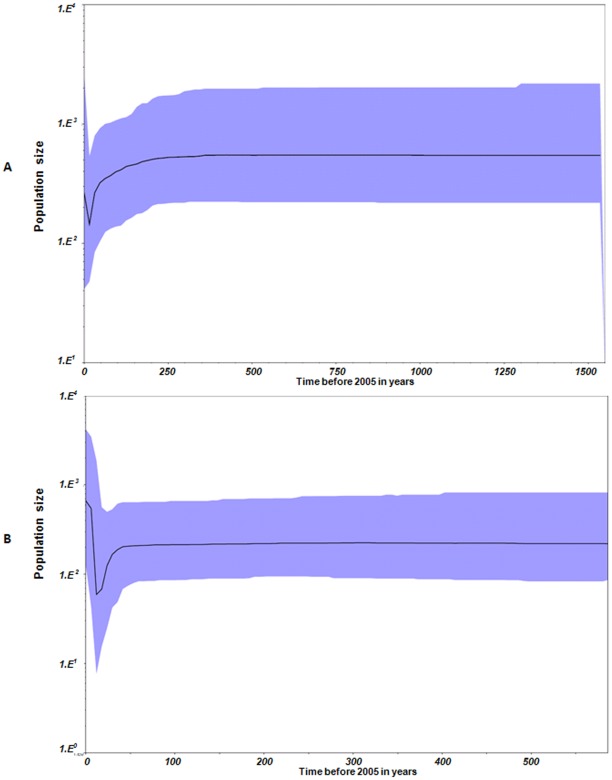
Figure 8. Bayesian skyline plots for segments 10 (A) and 12 (B) of LNV.
The Bayesian skyline plots for both genes indicated that the virus had maintained relatively stable population sizes over the last 1553 years. However, in both segments 10 and 12, data suggested a temporary population decline during the late 1980s and early 1990s. Seg-12 data also suggest that a beginning of an expansion started in the late 1990s.

