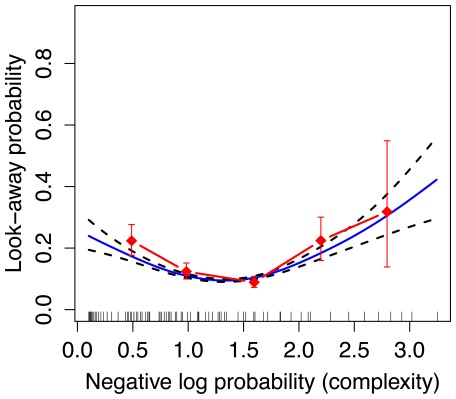
Figure 5. U-shaped curve for three-box display used in Experiment 2.
The solid curve represents the fit of a GAM, relating complexity as measured by the transitional MDM to look-away probability. Dashed curves show GAM standard errors. The GAM fits include the effect of complexity (negative log probability) and the effect of position in the sequence. Note, the error bars and GAM errors do not take into account subject effects. Vertical spikes on the  -axis represent data points collected at each complexity value. The red diamonds represent the raw look-away probabilities binned along the
  -axis.

