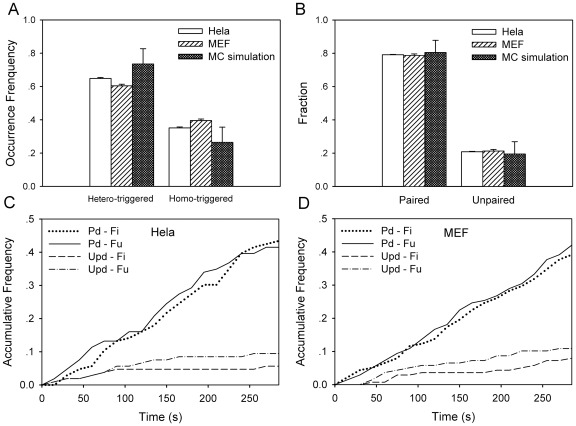
Figure 4. Multi-dynamic patterns in a Hela or MEF cell or from simulations.
Comparisons of occurrence frequency of distinct patterns in a Hela (A) and fraction of paired and unpaired events (B) in a Hela (open bars) or MEF (hatched bars) cell as well as from Monte-Carlo simulations (solid bars). Also plotted were the time courses of accumulative frequency of paired (Pd) or unpaired (UPd) fission (Fi) and fusion (Fu) events in a Hela (C) or MEF (D) cell up to t = 285 s. Data were presented as mean ± standard error (SE) measured from total 21–43 mitochondria and 121–231 events per cell.

