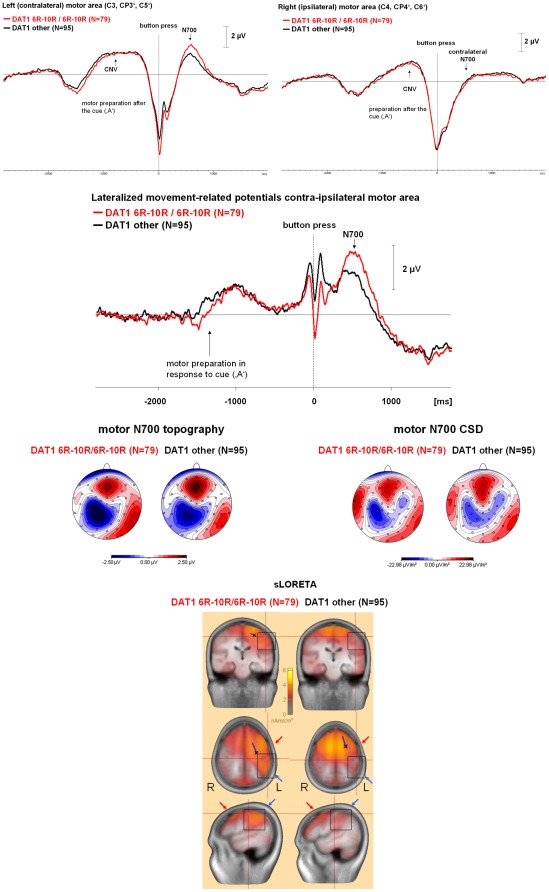
Figure 1. Time course and topography of the motor PINV by DAT1 haplotype.
Top: The time course of the response-locked motor PINV over the contra- and the ipsilateral motor area is shown. Negativity is up. There were no differences between the genotype groups during response preparation (contingent negative variation, CNV) after the cue (‘A’). Differences selectively affected the post-processing interval. During the button press (vertical dashed line), response selection during the P300 shadows the movement-related potentials. Thus, we calculated the lateralized motor PINV: Time course of the lateralized motor PINV when the potential over the contra- and ipsilateral motor areas is subtracted. This eliminates the symmetrically distributed parts of stimulus-related processing. Negativity is up. The peak immediately preceding the button press, which is related to the cortico-spinal command to muscle contraction, was influenced rather in the opposite direction to the motor PINV. Middle: Topography of the motor PINV: Isopotential line maps of the voltage topography and of the current source density (CSD) are shown, the head is presented in the top view from above, the nose is pointing upwards. Negativity and current sinks are reflected by blue areas, positivity and current sources are illustrated by red areas. Note the contralateral lateralization. Bottom: sLORETA source analysis results illustrating the effects of DAT1 polymorphisms on the lateralized motor PINV: Note the stronger centro-parietal activation in Brodman areas 1–4 and 40 for the 6R–10R/6R–10R group, which is missing in the non 6R–10R/6R–10R group (marked by squares and blue arrows). Activation in the premotor area and frontal eye field (BA 6/8) was more bilateral in the non 6R–10R/6R–10R group (red arrows). The blue dipole indicates that RAP-MUSIC yielded a spatial component that showed a localization and orientation which explained the lateralized centro-parietal activation only for the 6R–10R/6R–10R group (details not shown). The crossing red lines were set to a point near the motor cortex hand area in order to illustrate the cortical activation in this area (cf. Figure 4).

