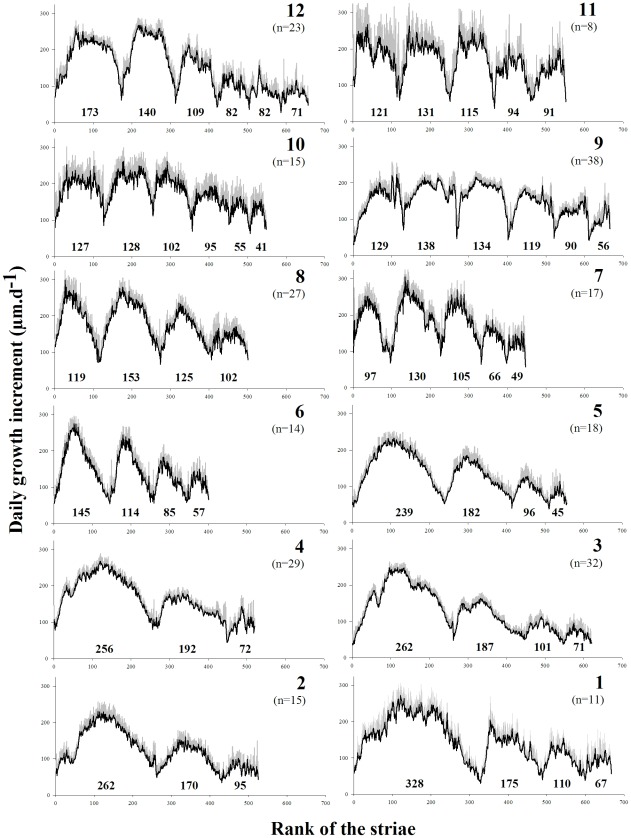
Figure 4. Variation in mean daily shell growth throughout life (black line) for each sampled population.
Gray vertical bars represent the 95% confidence interval of each mean value. The numbers in each graph indicate the annual number of growth days. (1) Vigo, (2) Ile de Re, (3) Bay of Brest, (4) Bay of Seine, (5) Plymouth, (6) Holyhead, (7) Scarborough, (8) Campbell Town, (9) Austevoll, (10) Bessaker, (11) Bronnoysund, and (12) Traena.

