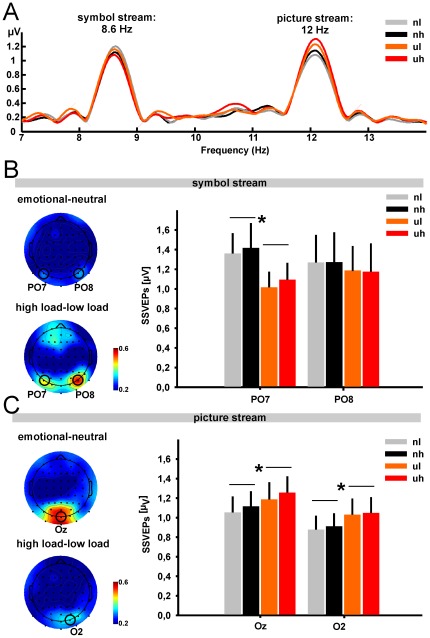
Figure 3. SSVEP amplitudes and iso-contour voltage maps.
(A) Grand-average spectrum obtained by Fourier analysis of SSVEP waveforms for all four experimental conditions, i.e. neutral pictures and low load (light grey line), neutral pictures and high load (black line), unpleasant pictures and low load (orange line) and unpleasant pictures and high load (red line) averaged across occipital electrodes (PO8, OZ, PO7). Peaks are located at the two stimulation frequencies at which the symbol stream and the picture stream were presented. (B) Iso-contour voltage maps based on the difference between the topographical distribution of emotional minus neutral SSVEP amplitudes (upper left panel) and high load minus low load SSVEP amplitudes (lower left panel) at the stimulation frequency of the symbol stream (8.6 Hz). The right panel shows the grand-average SSVEP amplitudes and corresponding standard errors for the symbol stream and each experimental condition for the two electrodes indicated in the iso-contour voltage maps (PO7, PO8). (C) Iso-contour voltage maps based on the difference between the topographical distribution of emotional minus neutral SSVEP amplitudes (upper left panel) and high load minus low load SSVEP amplitudes (lower left panel) at the stimulation frequency of the picture stream (8.6 Hz). The right panel shows the grand-average SSVEP amplitudes and corresponding standard errors for the picture stream and each experimental condition for the two electrodes indicated in the iso-contour voltage maps (OZ, O2). Abbreviations: nl = neutral low load; nh = neutral high load; ul = unpleasant low load; uh = unpleasant high load.

