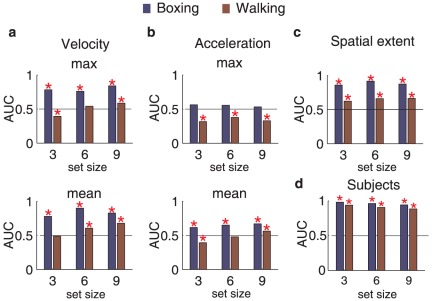
Figure 4. Results of the ROC analysis.
Accuracy measured by the area under the ROC curve (AUC) for maximum and mean velocity (A), and acceleration (B) signals, spatial extent (C) and the observers' average performance (D). Neither velocity, acceleration or spatial extent ROC analyses reached levels comparable to human performance. No analysis yields a search asymmetry effect (an increase in difference between boxing and walking target as set size increases). These analyses show that local motion signals cannot explain our findings. Red stars indicate significant difference from chance level performance (p<.05).

