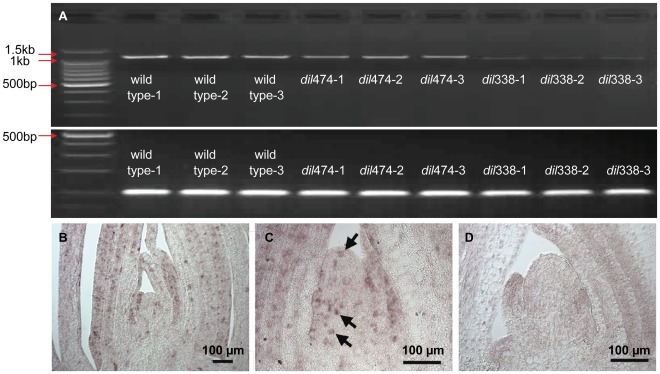
Figure 5. Expression analysis of DIL1 gene.
A. DIL1 mRNA levels in V3 leaves in wild type and mutant plants, as determined by RT-PCR with 30 cycles for DIL1 (Upper), with the actin gene as the control (Lower). B-D. RNA in situ hybridization on tissue sections from A619 wild type vegetative apices, showing expression of DIL1 in the leaf primordia and the P0 region of the meristem (B and C). Hybridization signal was not observed with control, sense probes (D).

