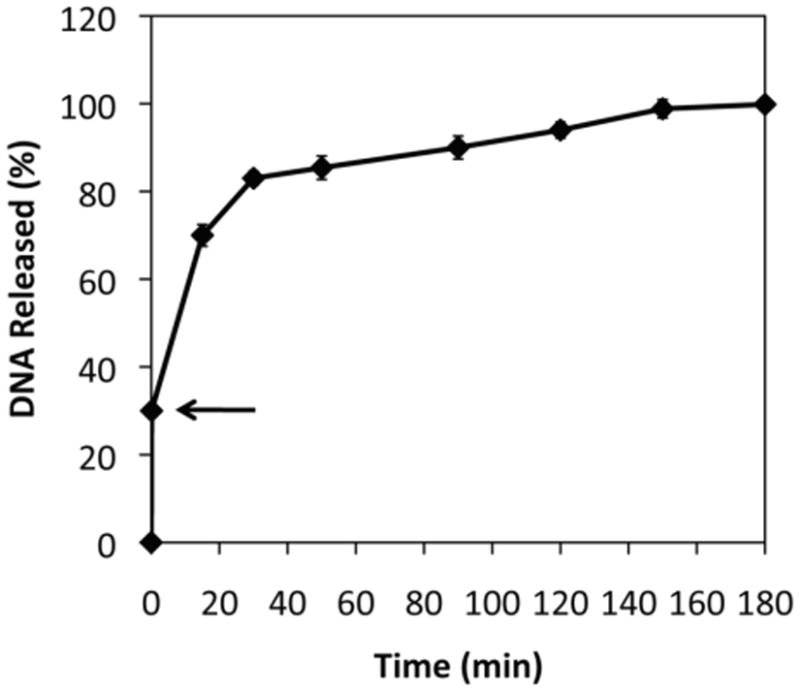
Figure 5.

Plot showing the release of DNA from polymer 1/DNA films incubated at an applied potential of -1.1 V for 5 sec and then subsequently incubated in PBS in the absence of an applied potential (see text). The arrow indicates the point at which the potential was removed. Error bars show the standard deviation of the percentage of DNA released using multiple measurements of samples during experiments using two different film-coated electrodes.
