
FIG.2. Runx2 and Col10α1 mRNA is upregulated in transgenic mice at E17.5 and P1 stages.
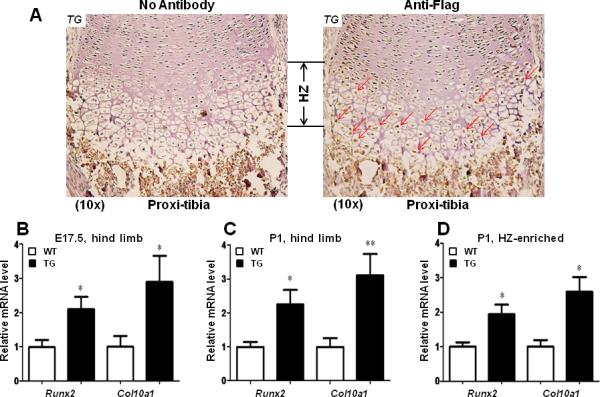
(A). Immunohistochemistry analysis was conducted on TG mouse hind limb sections with or without anti-Flag antibody. Brown staining showing Flag expression was primarily restricted to the pre-hypertrophic and hypertrophic chondrocytes of proximal tibia (right panel, red arrows). Left panel shows no antibody control. TG: Transgenic. HZ: hypertrophic zone. (B). Relative mRNA transcripts of Col10a1 and Runx2 were examined using total RNAs prepared from whole hind limbs at E17.5 stage. Runx2 showed two-fold upregulation in transgenic (TG) mice compared to their wild-type (WT) littermates (WT vs. TG: 1.00 ± 0.20 vs. 2.10 ± 0.36, n = 6, t = 2.69, df = 10, p = 0.02). Meanwhile, Col10a1 expression was also increased in TG mice (WT vs. TG: 1.00 ± 0.32 vs. 2.89 ± 0.77, n = 5, t = 2.27, df = 8, p = 0.05). (C). As illustrated, both Runx2 and Col10a1 showed similar increased level of mRNA transcripts in TG mice at P1 stage (Runx2, WT vs. TG: 1.00 ± 0.15 vs. 2.25 ± 0.43, n = 6, t = 2.78, df = 10, p = 0.02; Col10α1, WT vs. TG: 1.00 ± 0.26 vs. 3.11 ± 0.63, n = 5-6, t = 3.30, df = 9, p = 0.009). (D). Runx2 and Col10a1 also showed upregulation in transgenic mice using total RNAs prepared from hypertrophic zone-enriched tissues at P1 stag (Runx2, WT vs. TG: 1.00 ± 0.13 vs. 1.94 ± 0.28, n = 4-8, t = 2.04, df = 10, p = 0.043; Col10α1, WT vs. TG: 1.00 ± 0.19 vs. 2.59 ± 0.43, n = 4-8, t = 2.50, df = 10, p = 0.031). TG: transgenic; WT: wild-type littermates. Bars denote means ± SE for Runx2 and Col10α1 expression. “*”: p < 0.05; “**”: p < 0.01.