
FIG.4. Histology analysis of mouse growth plates.
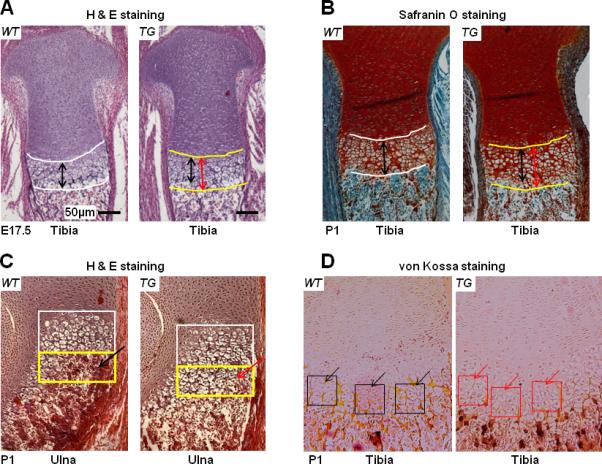
(A). H&E staining of sagittal sections of proximal tibia suggested longer hypertrophic zone in E17.5 TG mouse embryos (red double arrows) compared to WT littermates (black double arrows). Bars represent 50 μm. (B). Safranin O/Fast Green staining of P1 proximal tibia sections also indicated that TG mice (red double arrows) have longer hypertrophic zone than littermate controls (black arrows). (C). More layers of hypertrophic chondrocytes can be seen in sagittal sections of proximal ulna in TG mice (yellow rectangle, red arrow) at P1 stage compared to littermate controls (yellow rectangle, black arrow). (D). von Kossa staining was performed to quantify matrix mineralization on proximal tibia of TG or WT mice at P1 stage. Less von Kossa staining (black dots) suggesting decreased mineralization was shown in the hypertrophic zone of TG mice (red square and arrows) compared to WT littermate controls (black square and arrows).