
Figure 4.
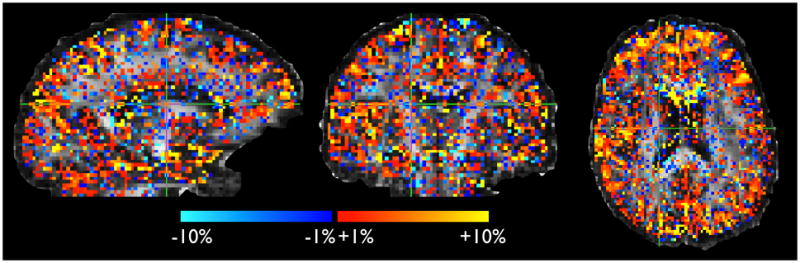
Relative difference in sum-of-squared errors between data and predictions from Gamma and noise floor models. Error is smaller for the Gamma models in the red voxels, and smaller for the noise floor model in the blue voxels. This map is thresholded at 1%. We can see that the Gamma model gives better fits on the interface voxels between grey and white matter. Note that the two models have the same number of parameters.