
Figure 7.
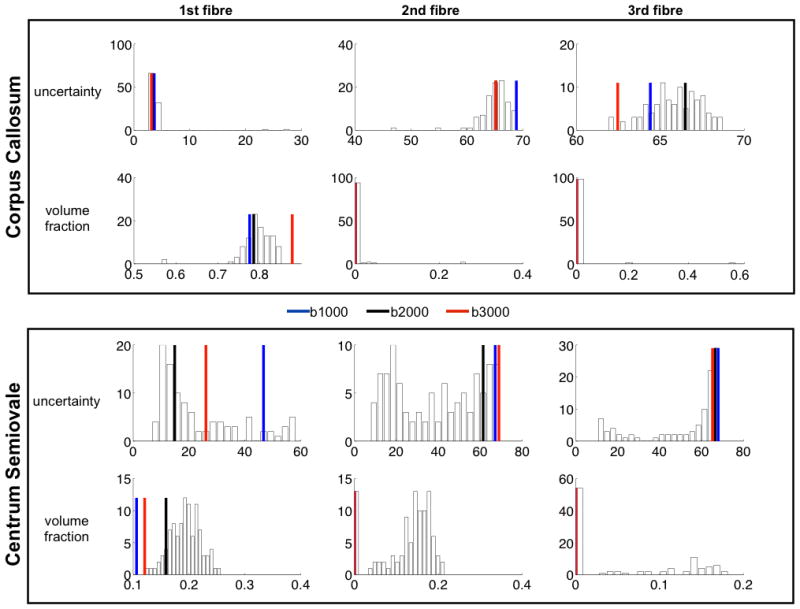
Performance of 60 directions single versus multi shell. The histograms show distributions across 100 bootstrap multi-shell data sets with 3×20 directions (see main text). The colored vertical bars are parameter estimates for the b1000 (blue), b2000 (black) and b3000 (red) single shell data. The Gamma model was fitted to the multi-shell data, and the equivalent results in the corpus callosum voxel. However only in the case of the multi-shell data were we able to fit a 3-way crossing (indicated by lower uncertainty and higher volume fraction). Uncertainty is shown in degrees.