
Figure 8.
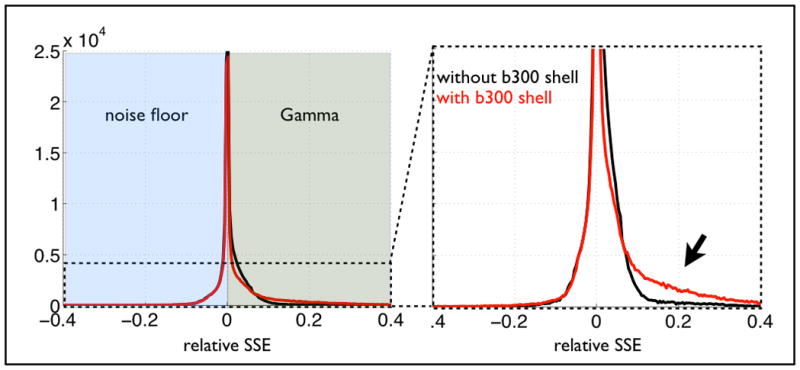
Histograms of relative difference in sum-of-squared error (SSE) between noise floor model and Gamma distribution model. The figure shows the same histogram from fitting the models to data with (red) and without (black) a smaller shell (b=300 s/mm2, 20 directions). Negative (resp. positive) SSEs correspond to areas where the noise floor model performs better (resp. worse) than the Gamma model. It is clear that adding a small shell improves the fit where the Gamma model outperforms the noise floor model, suggesting a better modelling of partial voluming with CSF. The left hand-side of the histogram remains unchanged.