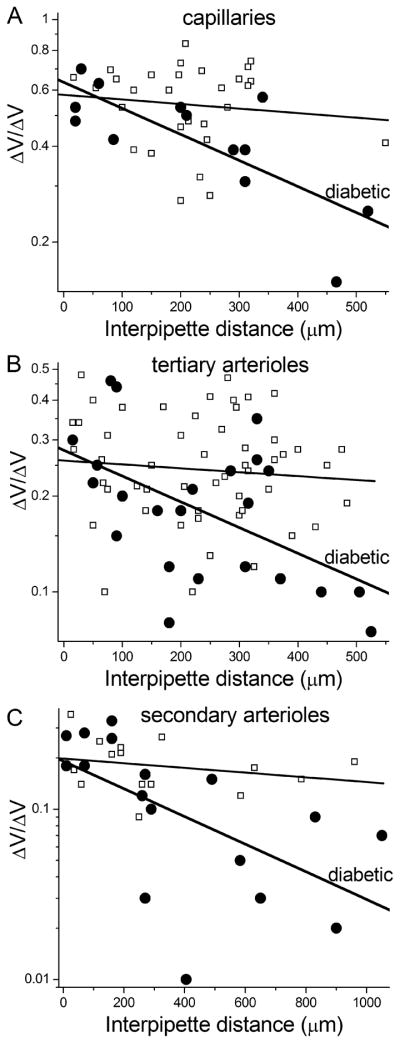
Figure 2.
Plots of ΔVresponder/ΔVstimulator ratios versus the distance between a pair of recording sites. Data are from diabetic (●) and non-diabetic (∀) microvessels. For each data set, the first-order exponential fit is shown. A, ratios for recordings from pairs of pericytes located on capillaries. 27 of the 29 data points in the non-diabetic group are from our recent study (Zhang et al., 2011). B, ratios for dual recordings from pairs of abluminal cells located on tertiary arterioles. In the non-diabetic group, 20 of the 54 data points are from the Zhang et al. study. C, ratios for dual recordings from pairs of smooth muscle cells that encircled secondary arterioles. 10 of the 15 data points in the non-diabetic group are from the study of Zhang et al.

