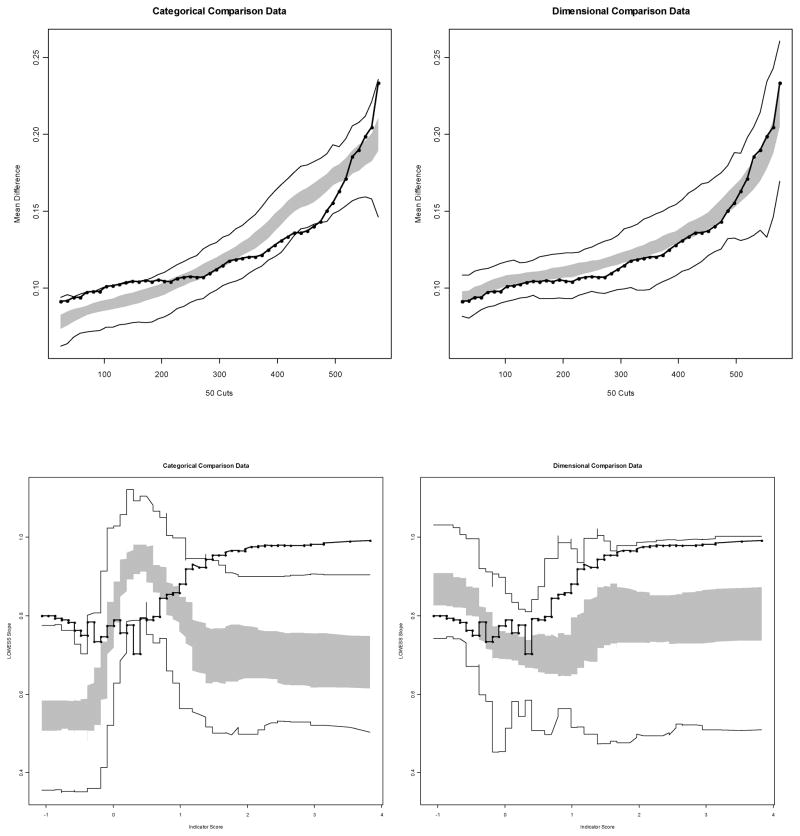
Figure 3.
Average MAMBAC and MAXSLOPE curves for the research data along with taxonic and dimensional comparison data for the inattention and hyperactivity/impulsivity subscales of the Self-Report Wender-Reimherr Adult Attention Deficit Disorder Scale. Dark lines on the curves represent the actual data, the outer lines show the minimum and maximum values generated by the 100 simulated data sets, with the grey band containing the middle 50% of data points from these simulated data.

