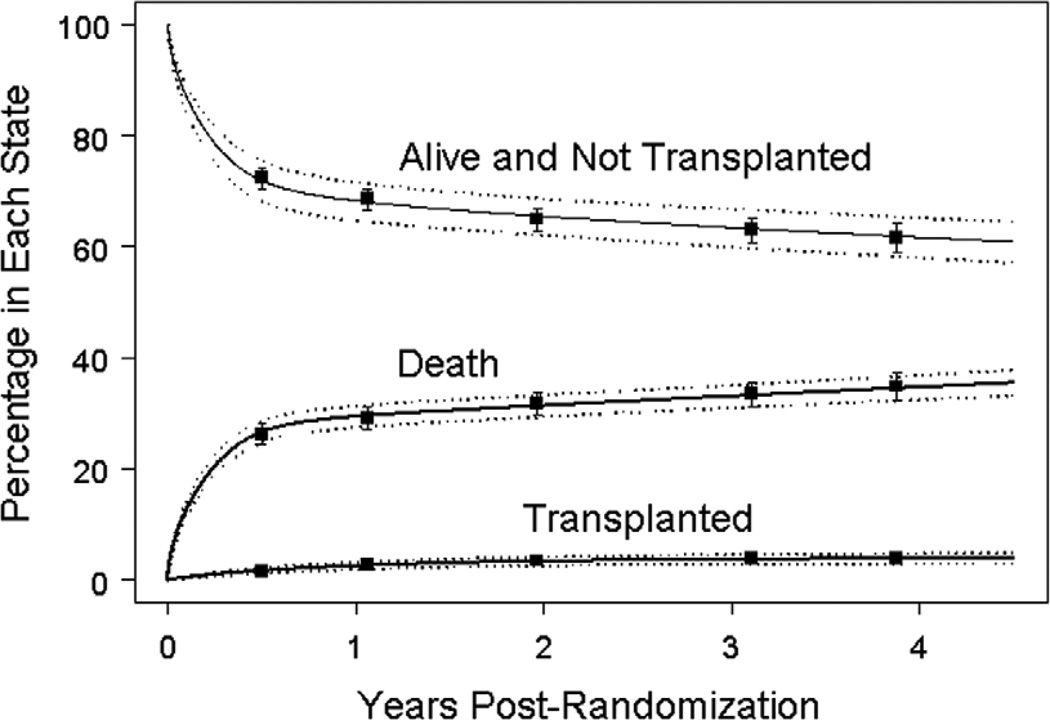
Figure 1.
Proportion of subjects in each of three competing mutually exclusive end-states: death, transplant and alive without transplant for all 549 subjects (solid curves). The dashed curves represent the pointwise 68% (1 standard error) confidence bands based on the parametric fit. The squares and associated error bars represent the nonparametric estimates ± one standard error.

