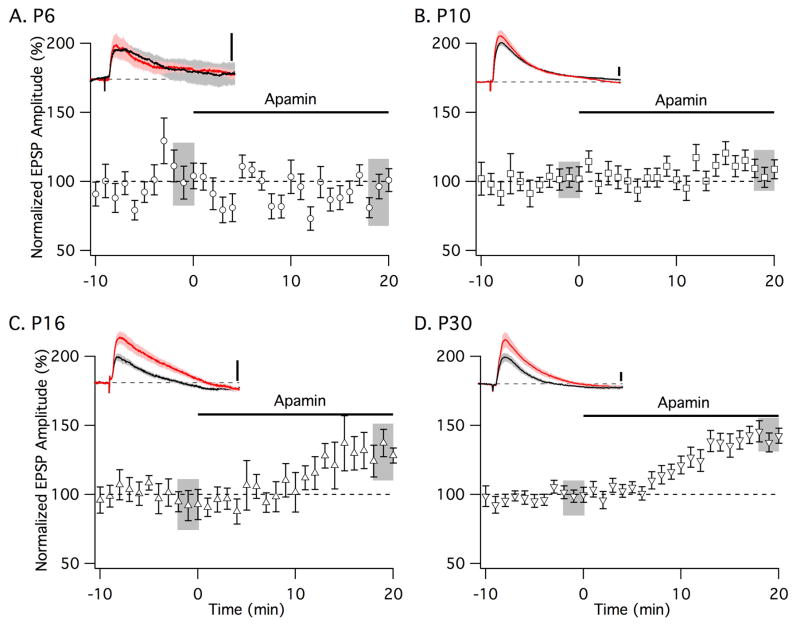
Figure 8.
Developmental expression of functional synaptic SK2 channels in hippocampal CA1 neurons. Time course of the normalized EPSP amplitude (mean ± SEM) from (A) P6, (B) P10, (C) P16, and (D) P30 mice. Left insets show representative average of five EPSPs, mean ± SEM. (shaded area) for baseline (black trace) and after apamin application (red trace). Vertical scale bars: 1 mV. Insets show 200 ms of recordings.

